Image Details
Caption: Figure 1.
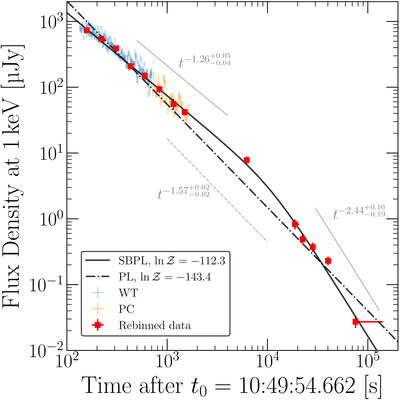
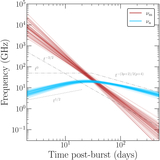
X-ray light curve for GRB 230815A. The data points obtained by Swift/XRT in WT mode are represented by the blue error bars, while those obtained in PC mode are represented by the orange error bars. The data points used in the fits to the X-ray light curve, obtained from binning the Swift/XRT data points, are represented by the red square markers. Fits to a smoothly broken power law and a power law are shown by the solid and dotted–dashed lines, respectively. The slopes of the fits are annotated beside the lines.
Other Images in This Article
Show More
Copyright and Terms & Conditions
© 2026. The Author(s). Published by the American Astronomical Society.
Copyright ©
2026 Astronomy Image Explorer. All Rights Reserved.