Image Details
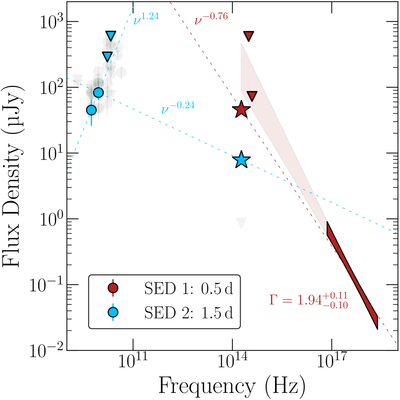
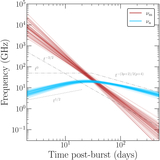
Caption: Figure 3.
Broadband SED of GRB 230815A, showing two temporal snapshots at approximately 0.5 (red) and 1.5 (blue) days postburst. The light gray points represent data from later epochs, after 1.5 days postburst. Radio detections are shown with circular markers, near-infrared detections are shown with star markers, and all upper limits are shown with inverted triangular markers. The X-ray spectrum (dark red filled) is extrapolated to the near-infrared part of the spectrum (light red filled) using a photon index of ﹩{\rm{\Gamma }}=1.9{4}_{-0.10}^{+0.11}﹩, where the shaded region corresponds to a 68% confidence interval. The slopes between various data points in each spectral snapshot are annotated next to the corresponding dashed guide lines.
Other Images in This Article
Show More
Copyright and Terms & Conditions
© 2026. The Author(s). Published by the American Astronomical Society.