Image Details
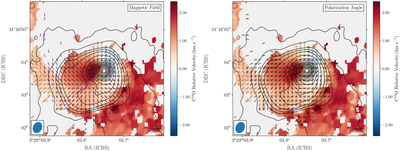
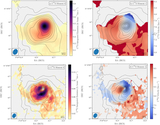
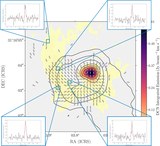
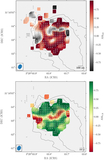
Caption: Figure 14.
Left panel: the C18O moment 1 map shown with robust = 0.5 in color scale, where the velocities are relative to vlsr = 7.36 km s−1. Superposed in yellow pseudovectors is the velocity gradient, which was computed over the moment 1 map. Also, superposed in magenta pseudovectors is the inferred magnetic field as derived from the polarized emission, also imaged using robust = 0.5. In contours, we show the total intensity of the continuum emission. Right panel: same as the left panel but with the polarization position angle as black pseudovectors. The beam is depicted as a blue ellipse in the bottom left corner, and the scale is displayed in the bottom right corner of each panel.
Other Images in This Article
Show More
Copyright and Terms & Conditions
© 2025. The Author(s). Published by the American Astronomical Society.