Image Details
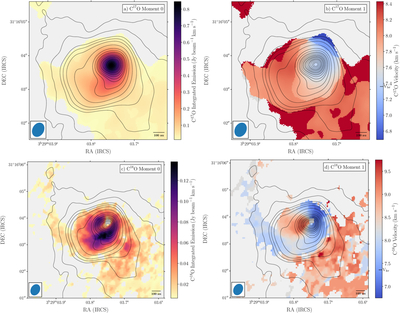
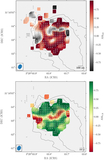
Caption: Figure 5.
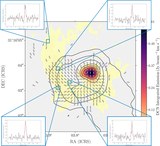
(a) The C17O(J = 3 → 2) moment 0 map imaged using robust = 1 is superposed with the contours from the dust continuum emission at levels of 1.5, 3, 7, 10, 15, 28.7, 54.9, 81.1, 110, 130, 160, 190, 210, 240, 260, 290, 320, and 340 mJy beam−1. The moment maps were produced considering pixels between 15 mJy beam−1 and the peak emission in C17O and channels between 8.4 and 9.3 km s−1. (b) Same as panel (a) but for the moment 1 velocity field map. The dust continuum contours are superposed using the same map and levels. Note that the Vlsr = 7.36 km s−1 is indicated at the color bar in each moment 1 map. (c) In this panel, we show the moment 0 map from C18O(J = 2 → 1) emission. Superposed on the map, we show the same contours from dust emission as in panel (a). The C18O moment maps were produced under the same threshold as the C17O maps and within a velocity range of 6.75–10 km s−1. (d) Same as panel (c) but for the C18O moment 1 map. The relative size of the beam is shown as a blue ellipse in the bottom left corner, and the scale is shown in the bottom right corner in each panel.
Other Images in This Article
Show More
Copyright and Terms & Conditions
© 2025. The Author(s). Published by the American Astronomical Society.