Image Details
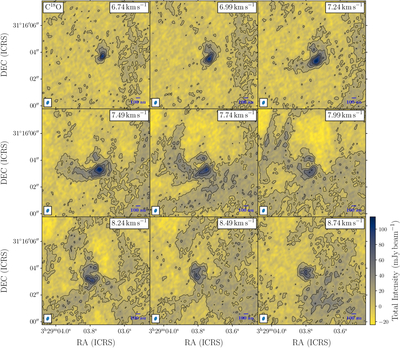
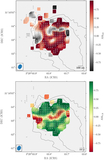
Caption: Figure 6.
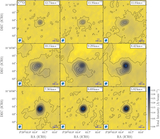
Channel maps of C18O emission shown in color scale between 6.7 and 8.7 km s−1, where the layout follows Figure 4. Superposed are C18O contours in black with values of 10, 30, 50, and 70 mJy beam−1.
Other Images in This Article
Show More
Copyright and Terms & Conditions
© 2025. The Author(s). Published by the American Astronomical Society.
Copyright ©
2025 Astronomy Image Explorer. All Rights Reserved.