Image Details
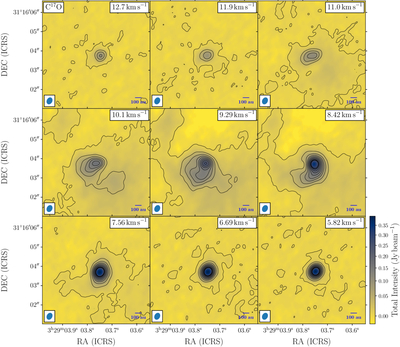
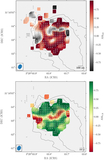
Caption: Figure 4.
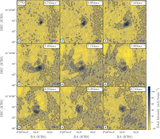
Channel maps of C17O emission in color scale between 5.8 and 12.7 km s−1 with the channel velocity indicated in white at the top right corner within each channel map. Superposed are C17O contours in black with values of 4.32, 19.1, 33.8, 48.6, 63.4, 78.1, 92.9, 110, 120, 140, 150, 170, 180, 200, 210, 230, 240, 260, and 270 mJy beam−1. The beam is represented as a blue ellipse in the bottom left corner, and the scale is shown in the bottom right corner.
Other Images in This Article
Show More
Copyright and Terms & Conditions
© 2025. The Author(s). Published by the American Astronomical Society.
Copyright ©
2025 Astronomy Image Explorer. All Rights Reserved.