Image Details
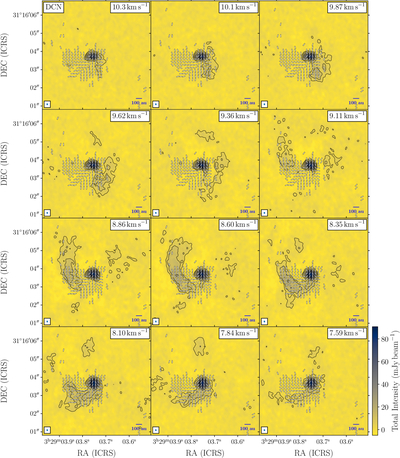
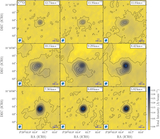
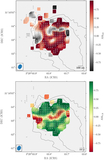
Caption: Figure 7.
Channel maps of DCN emission shown in color scale between 7.6 and 10.3 km s−1, also following Figure 4. Superposed are DCN emission contours in black with values of 4, 9, 19, 29, 39, 49, 59, 69, 80, 90, and 100 mJy beam−1. At each channel, we also show the inferred magnetic field morphology from polarized dust emission as a map of white pseudovectors, plotted every 8 pixels to allow clearer comparison with the underlying DCN emission. The data were imaged using robust = 2 and smoothed using a kernel of ﹩0\mathop{.}\limits^{^{\prime\prime} }1﹩ to enhance the streamer.
Other Images in This Article
Show More
Copyright and Terms & Conditions
© 2025. The Author(s). Published by the American Astronomical Society.
Copyright ©
2025 Astronomy Image Explorer. All Rights Reserved.