Image Details
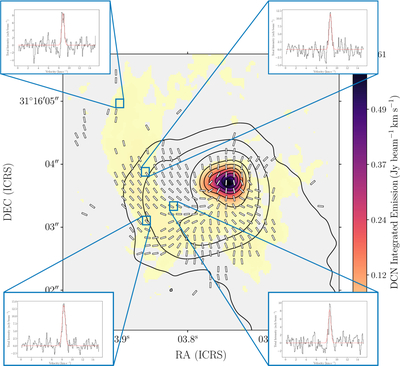
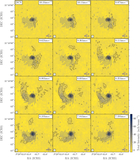
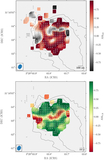
Caption: Figure 8.
DCN(J = 3 → 2) moment 0 map integrated from 7.6 to 10.3 km s−1. Overlaid are dust continuum contours at levels of 3, 10, 28, 81, 130, 190, 240, and 290 mJy beam−1 (robust = 0.5). The inferred magnetic field morphology is shown as white pseudovectors. DCN spectra from selected regions along the streamer are displayed in zoomed-in panels, with the corresponding Gaussian fits indicated by dotted red curves.
Other Images in This Article
Show More
Copyright and Terms & Conditions
© 2025. The Author(s). Published by the American Astronomical Society.
Copyright ©
2025 Astronomy Image Explorer. All Rights Reserved.