Image Details
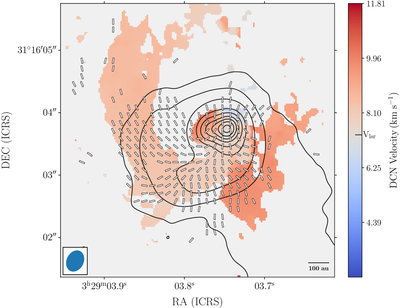
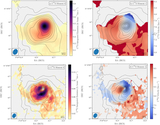
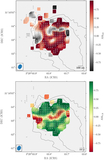
Caption: Figure 11.
The moment 1 map from DCN emission using the same layout as Figure 8 with the SVS 13A systemic velocity indicated in the color bar (Vlsr = 7.36 km s−1). The beam is depicted as a blue ellipse in the bottom left corner, and the scale is displayed in the bottom right corner.
Other Images in This Article
Show More
Copyright and Terms & Conditions
© 2025. The Author(s). Published by the American Astronomical Society.
Copyright ©
2025 Astronomy Image Explorer. All Rights Reserved.