Image Details
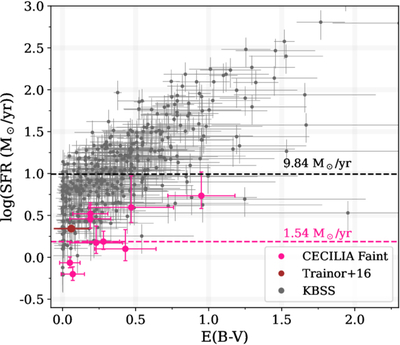
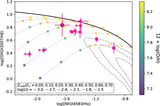
Caption: Figure 5.
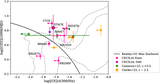
Log(SFR) vs. E(B − V) for the CECILIA faint sample (pink circles), the T16 KBSS-Lyα stack point (brown circle), and KBSS LBGs from S17 (gray circles). The horizontal dashed pink line indicates the median SFR of the CECILIA faint sample, while the dashed black line marks the median SFR for the KBSS points. A positive correlation is seen between dust attenuation and SFR across the samples.
Other Images in This Article
Show More
Copyright and Terms & Conditions
© 2025. The Author(s). Published by the American Astronomical Society.
Copyright ©
2025 Astronomy Image Explorer. All Rights Reserved.