Image Details
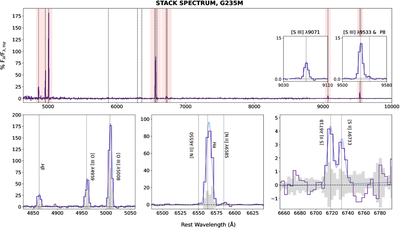
Caption: Figure 3.
The rest-frame NIRSpec G235M stack spectrum (NB, fLBGs, and serendipitous sources). The purple line represents the 1D extracted spectrum, while the blue line illustrates the Gaussian+linear continuum fit to the emission lines. The gray shaded area indicates the error margin. A horizontal dashed black line at y = 0 marks the zero level. Black dashed vertical lines indicate the positions of key spectral features—most of which are shown in the bottom panels—as well as emission lines with >2σ detections. Individual spectra are normalized by their integrated Hα flux prior to stacking. The resulting stacked spectrum is then rescaled such that the Hα peak of the fit model has a value of 100, allowing all other emission line peaks to be expressed as percentages of the Hα peak.
Other Images in This Article
Show More
Copyright and Terms & Conditions
© 2025. The Author(s). Published by the American Astronomical Society.