Image Details
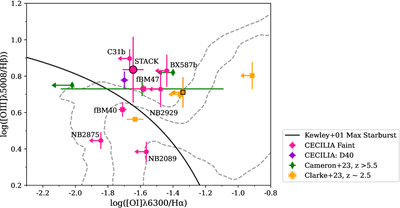
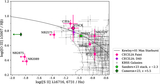
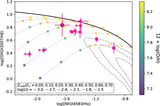
Caption: Figure 8.
O1-BPT (S. Veilleux & D. E. Osterbrock 1987) showing SDSS z ∼ 0 galaxies (gray contour lines), CECILIA faint LAEs (pink circles with 2σ limits), CECILIA faint LBGs (pink squares), CECILIA D40 (purple circle), Lyman-break galaxies from A. J. Cameron et al. (2023; green diamonds), and SF galaxies at z ∼ 2.5 (orange squares; stacked point with black outline) from L. Clarke et al. (2023). The solid black line represents the theoretical starburst classification curve from L. J. Kewley et al. (2001), separating SF galaxies from objects with other ionization mechanisms.
Other Images in This Article
Show More
Copyright and Terms & Conditions
© 2025. The Author(s). Published by the American Astronomical Society.
Copyright ©
2025 Astronomy Image Explorer. All Rights Reserved.