Image Details
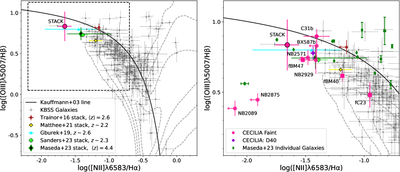
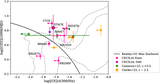
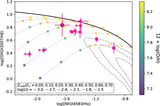
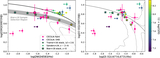
Caption: Figure 6.
Left: N2-BPT diagram (J. A. Baldwin et al. 1981) with SDSS z ∼ 0 galaxies (gray, contour lines), KBSS LBGs (S17; gray dots with 3σ detections for every line), a lensed dwarf galaxy (T. Gburek et al. 2019), stacks of faint LAEs (T16; J. Matthee et al. 2021; M. V. Maseda et al. 2023), stack of high-z galaxies (R. L. Sanders et al. 2023), and the CECILIA stack of faint galaxies (pink point). The solid black line is the classification curve used by G. Kauffmann et al. (2003) as a lower limit for finding AGNs. The dashed box highlights the region shown in the zoomed-in version. Right: zoomed-in N2-BPT diagram showing individual CECILIA faint galaxies (pink points; 2σ limits, with squares indicating fLBGs), the z ∼ 3 SF galaxy D40 observed with JWST/NIRSpec as part of the CECILIA program (purple point), and individual data points from M. V. Maseda et al. (2023).
Other Images in This Article
Show More
Copyright and Terms & Conditions
© 2025. The Author(s). Published by the American Astronomical Society.