Image Details
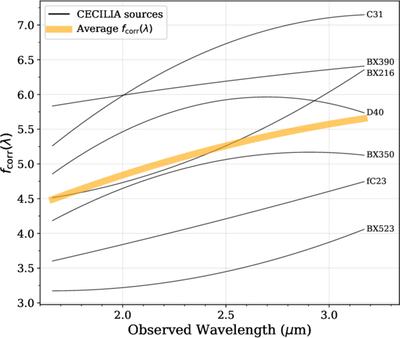
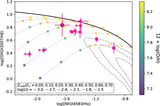
Caption: Figure 2.
Flux correction functions fcorr(λ) for galaxies in the overall CECILIA sample with well-measured SEDs, below-median luminosities, and below-median sizes. The black curves show the individual flux correction functions for these galaxies, while the thick orange curve shows the average flux correction function, constructed as the arithmetic mean of the individual fcorr(λ) curves.
Other Images in This Article
Show More
Copyright and Terms & Conditions
© 2025. The Author(s). Published by the American Astronomical Society.
Copyright ©
2025 Astronomy Image Explorer. All Rights Reserved.