Image Details
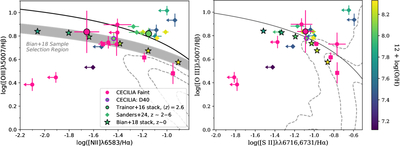
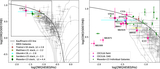
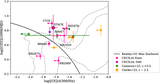
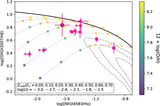
Caption: Figure 10.
N2 (left) and S2-BPT (right) diagrams. Our data points are compared to 11 galaxies at z ∼ 2–6 from R. L. Sanders et al. (2024; diamonds) and the stacked points from F. Bian et al. (2018; stars), both color-coded by their direct metallicities, as indicated by the color bar on the right. The F. Bian et al. (2018) sample was selected on the basis of N2-BPT line ratios, with the gray shading denoting the selection region. In the N2-BPT diagram, the stacked point from T16 and D40 from R24 (black and purple outlines, respectively) are shown as circles with the same O/H-based central color coding.
Other Images in This Article
Show More
Copyright and Terms & Conditions
© 2025. The Author(s). Published by the American Astronomical Society.