Image Details
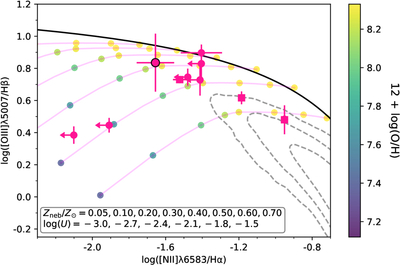
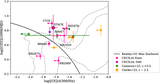
Caption: Figure 9.
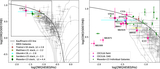
The N2-BPT predictions from the Cloudy photoionization models are shown, using input spectra from BPASS stellar populations. The pink lines represent tracks of fixed ﹩{\mathrm{log}}\,U﹩, where higher ﹩{\mathrm{log}}\,U﹩ values result in higher O3 ratios. The model points are color-coded by O/H as indicated by the color bar. We overplot the CECILIA NB sample (pink points), fLBG sources (pink squares), and SDSS z ∼ 0 galaxies (gray contours).
Other Images in This Article
Show More
Copyright and Terms & Conditions
© 2025. The Author(s). Published by the American Astronomical Society.
Copyright ©
2025 Astronomy Image Explorer. All Rights Reserved.