Image Details
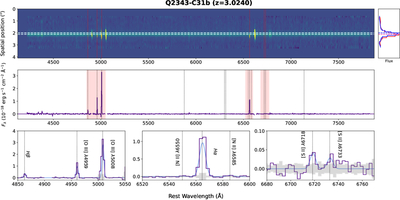
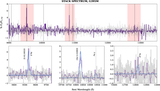
Caption: Figure 12.
The rest-frame NIRSpec spectrum of the serendipitous source Q2343-C31b. Top: 2D spectrogram of the source, with the emission lines marked by red vertical lines and the two white dashed lines indicating the centers of the main and serendipitous sources. Adjacent to the spectrogram, the panel shows the 1D spatial distribution of the continuum for the main source in blue (with the blue dashed line marking the center of the main source). Additionally, the 1D spatial distribution of the brightest emission lines from the serendipitous source is shown in red (with the red dashed line marking the center of the serendipitous source). Middle: full spectral range of the G235M spectrum for the source. Black dashed vertical lines and shaded bands indicate the positions of key spectral features—most of which are shown in the bottom panels—and emission lines with >2σ detections. The 1D extracted spectrum is shown in purple. Bottom: zoom-in panels of key spectral features. The Gaussian+linear continuum fit to the emission lines is shown in light blue, and the error region is shown in gray.
Other Images in This Article
Show More
Copyright and Terms & Conditions
© 2025. The Author(s). Published by the American Astronomical Society.