Image Details
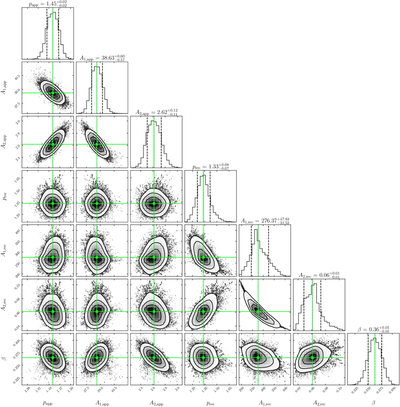
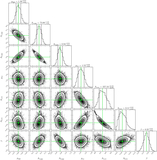
Caption: Figure 8.
Correlations between the main parameters calculated by MCMC. The median values and the ≈1σ uncertainties are shown by the middle and surrounding dashed lines, respectively. The corresponding numerical values are given by the posterior distributions. The fits with Δξ = 1.5 mas and with Δξ = 2.0 mas are shown.
Other Images in This Article
Copyright and Terms & Conditions
© 2025. The Author(s). Published by the American Astronomical Society.
Copyright ©
2025 Astronomy Image Explorer. All Rights Reserved.