Image Details
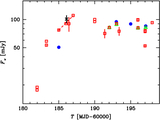
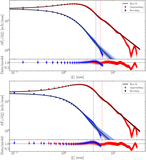
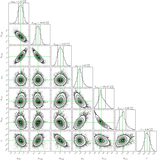
Caption: Figure 3.
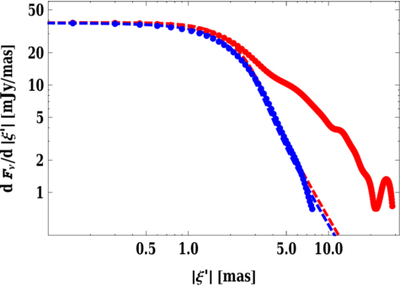
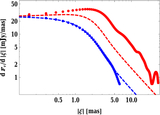
The emission profiles of the jet (red) and counterjet (blue) compared to our model assuming symmetric jets and Δξ = 0. We required the model to reproduce the range of ∣ξ∣ ≲ 1, in which case the approaching jet model completely misses the profile at ∣ξ∣ ≳ 2. For clarity, the error bars are not shown.
Other Images in This Article
Copyright and Terms & Conditions
© 2025. The Author(s). Published by the American Astronomical Society.
Copyright ©
2025 Astronomy Image Explorer. All Rights Reserved.