Image Details
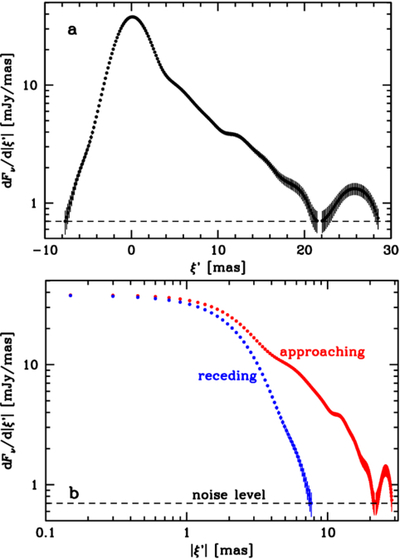
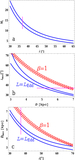
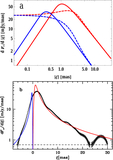
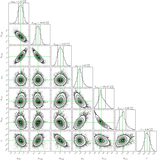
Caption: Figure 2.
The emission profiles at 8.37 GHz of the jet and counterjet (W24) adopting the zero-point of W24, determined by fitting a Gaussian to the central data. The horizontal black line corresponds to the noise level. (a) The angular separation from the center of the core is plotted linearly. (b) The angular separation is in the logarithmic scale, with the red and blue points corresponding, respectively, to the approaching and receding jets.
Other Images in This Article
Copyright and Terms & Conditions
© 2025. The Author(s). Published by the American Astronomical Society.
Copyright ©
2025 Astronomy Image Explorer. All Rights Reserved.