Image Details
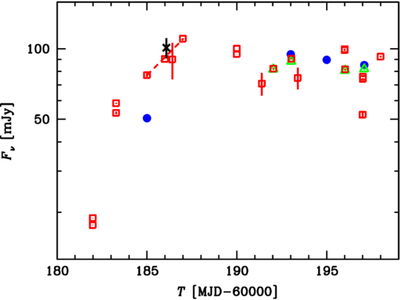
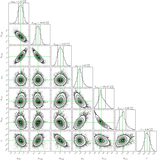
Caption: Figure 5.
The radio light curve compiled from different measurements (A. K. Hughes et al. 2025), including those reported in W24. The VLBA observation is shown by the black cross with an error bar. The measurements at 5–9 GHz, 3 GHz, and 1.3–1.5 GHz are shown by red open squares, green open triangles, and blue filled circles, respectively. We see that the VLBA observation was done close to the end of the rising part of the light curve.
Other Images in This Article
Copyright and Terms & Conditions
© 2025. The Author(s). Published by the American Astronomical Society.
Copyright ©
2025 Astronomy Image Explorer. All Rights Reserved.