Image Details
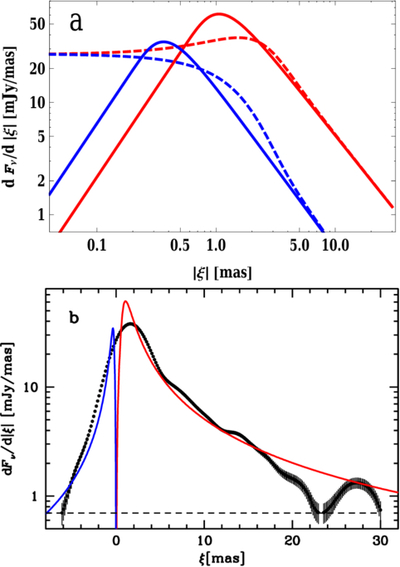
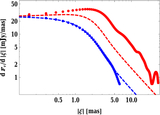
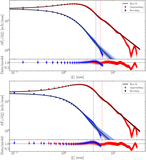
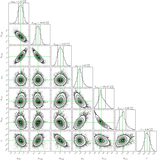
Caption: Figure 7.
(a) The model emission profiles of the jet (red) and counterjet (blue) for Δξ = 1.5 mas, with the same parameters as in Figure 6. The solid and dashed curves correspond to the emitted fluxes and those observed by the telescope, i.e., convolved with its restoring beam, respectively. (b) The emitted model fluxes (before the Gaussian smoothing) are compared with the data.
Other Images in This Article
Copyright and Terms & Conditions
© 2025. The Author(s). Published by the American Astronomical Society.
Copyright ©
2025 Astronomy Image Explorer. All Rights Reserved.