Image Details
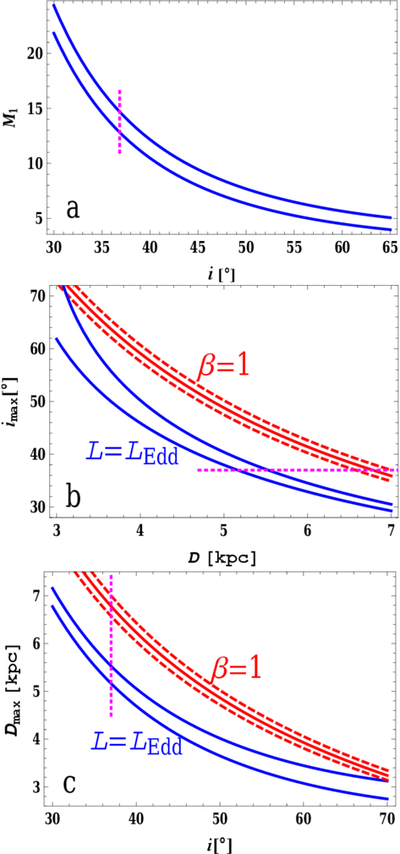
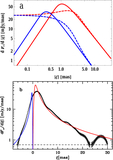
Caption: Figure 1.
(a) M1(i) from the mass function assuming the upper limit on f and M2 = 0.78 M⊙ and the lower limit on f and M2 = 0.2 M⊙, shown by the upper and lower blue curves, respectively. (b) The solid and dashed red curves give the upper limit on i(D) from the angular velocity of the fastest knot observed by C. M. Wood et al. (2025) for the best fit of μ and their limits, respectively; see Equation (3). The blue solid curves give the upper limits corresponding to L = LEdd for the luminous hard state based on H.-X. Liu et al. (2024) with the same assumptions on M1 as in panel (a). (c) The solid and dashed red curves give the upper limit on D(i) from Equation (3), analogous to panel (b). The blue curves show the upper limits on D assuming Lbol = LEdd. The dotted magenta lines at i = 37° on all panels correspond to M1 ≈ 13 M⊙.
Other Images in This Article
Copyright and Terms & Conditions
© 2025. The Author(s). Published by the American Astronomical Society.