Image Details
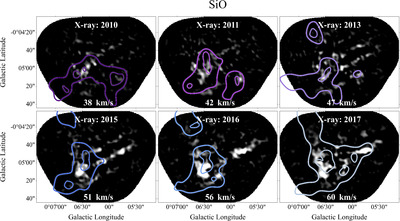
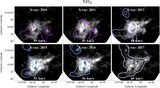
Caption: Figure A4.
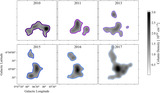
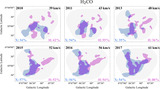
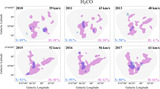
A comparison between each year of X-ray data and SiO integrated images made using an equal number of consecutive velocity slices contained within the full velocity range of the Sticks cloud. Each panel shown has the average velocity indicated at the bottom of the image. The contours for each X-ray year were matched with an integrated SiO image sequentially. We see relatively good agreement between the X-ray and molecular gas features, especially in the bottom three panels. The contour colors and widths are the same as shown in Figure 2. This analysis is the same as that shown in Figures 2 and A3 but using SiO.
Other Images in This Article
Copyright and Terms & Conditions
© 2025. The Author(s). Published by the American Astronomical Society.