Image Details
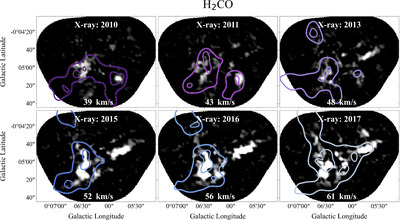
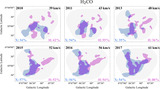
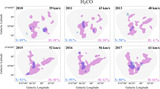
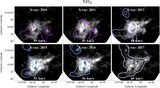
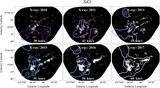
Caption: Figure 2.
A comparison between each year of X-ray observations (colored contours) and consecutive H2CO integrated velocity slices (grayscale background) suggests a good match in the overall morphological structures. Each panel shown has the average velocity indicated at the bottom of the image. The contours for each year of X-ray observations were matched with an integrated H2CO image sequentially. By eye, we see relatively good agreement between the X-ray and molecular gas features, especially in the bottom three panels. Unsurprisingly, the sequential comparison between X-ray echoes and velocity slices is not perfect though we do see some strikingly good correlation for the small-scale structure in years 2013, 2015, and 2016 especially.
Other Images in This Article
Copyright and Terms & Conditions
© 2025. The Author(s). Published by the American Astronomical Society.