Image Details
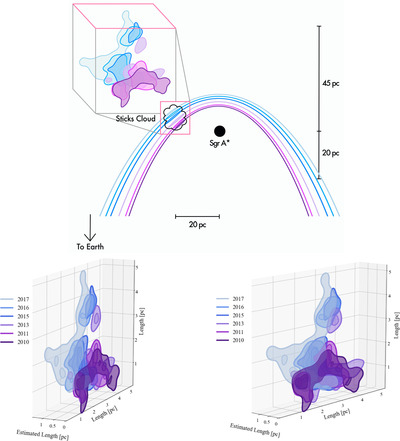
Caption: Figure 3.
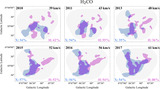
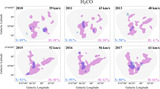
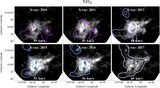
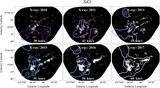
(Top) An illustration (not to scale) of the top-down view of the geometry of the Sticks cloud and Sgr A*. The separation between the Sticks cloud and the black hole is around 20 pc, but the position of the cloud either in front of or behind the black hole is less certain. The scale bar on the right side of the illustration indicates the range of distances the Sticks cloud could be at in front of or behind Sgr A*. The colored parabolas represent the X-rays traveling outward from the black hole, reflecting off the cloud, and traveling back to our observatories at Earth, and we observe the X-rays at discrete times. We use these slices in our tomography method to create a 3D model of the cloud, which is shown in the zoomed-in cube. The orientation of the X-ray observations depicted does not correspond to the top-down view of the Sticks cloud. The pink square around the cloud in the top-down view corresponds to the top of cube. (Bottom) 3D model of the Sticks cloud using the X-ray tomography method shown at two different rotation angles. The contour colors and widths are the same as shown in Figure 2. The axes have all been converted to parsecs to give an estimation of the size scale of the Sticks cloud. The physical distance between the X-ray years was calculated assuming the Sticks cloud is 25 pc behind the central black hole, along the line of sight, with an illuminating event age of 200 yr (F. Marin et al. 2023). This gives an approximate length of 1.25 pc between years 2010 and 2017. Previous estimates of the Sticks cloud line-of-sight position range from 20 pc in front to 45 pc behind (M. Clavel et al. 2013). This line-of-sight distance range would correspond to an “Estimated length” of 1.18–1.63 pc for the z-axis extent shown. An animated version of this figure is available that steps through each year of X-ray data to illustrate the tomography method, and it also shows a rotating version of the 3D model for the Sticks cloud. The duration is 9 s.
(An animation of this figure is available in the online article.)
(An animation of this figure is available.)
The video/animation of this figure is available in the online journal.
Other Images in This Article
Copyright and Terms & Conditions
© 2025. The Author(s). Published by the American Astronomical Society.