Image Details
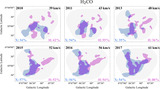
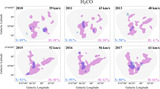
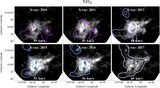
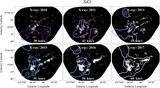
Caption: Figure 1.
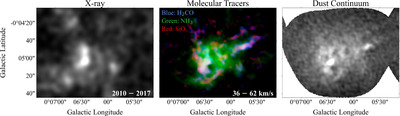
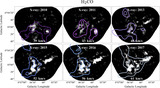
A comparison of the multiwavelength observations of the Sticks cloud used in this analysis shows good correlation between the X-ray echoes and the position of the molecular gas and dust. Left: integrated X-ray observations of 6.4 keV emission from 2010 to 2017 with Gaussian smoothing applied. Center: RGB image incorporating observations of H2CO (blue), NH3 (green), and SiO (red). Each molecular tracer image used to create the RGB image was integrated over the velocity range of the Sticks cloud, 36–62 km s−1. Right: CMZoom 1.3 mm dust continuum observation of the Sticks cloud. An interactive version of these panels is provided and shows the individual X-ray observations for each year as well as the individual molecular components that make up the RGB image. The buttons labeled “Integrated” and “RGB” correspond to the integrated X-ray image and the RGB molecular tracer image, respectively, that are shown in the noninteractive figure. The buttons labeled with years will show the X-ray data corresponding to that year. And the H2CO, NH3, and SiO buttons will show the corresponding tracer images. The standard Plotly buttons are shown when you pan your cursor over the interactive figure, and they include buttons to save the figure, zoom, pan, and reset the axes.
An interactive version of this figure is available in the online article.
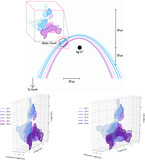
An interactive version of this figure is available.
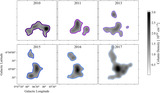
An interactive version of this figure is available in the online journal.
Other Images in This Article
Copyright and Terms & Conditions
© 2025. The Author(s). Published by the American Astronomical Society.