Image Details
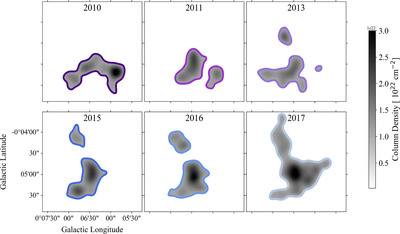
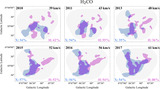
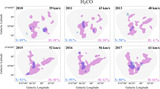
Caption: Figure 4.
The column density calculated for each year of X-ray observations of the Sticks cloud. The contours shown for each year are the same ones plotted in the previous figures. We see a variety of dense cores throughout the cloud in the X-ray observations.
Other Images in This Article
Copyright and Terms & Conditions
© 2025. The Author(s). Published by the American Astronomical Society.
Copyright ©
2026 Astronomy Image Explorer. All Rights Reserved.