

Image Details
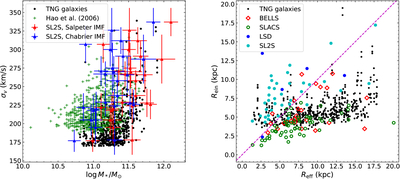
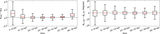
Caption: Figure 2.
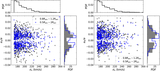
Properties of our lensing galaxy sample at z = 0.3 (snapshot 078) from the TNG100-1 simulation. Left: distribution of velocity dispersions and stellar masses of our sample, with the results of SL2S (C. N. Hao et al. 2006a; A. Sonnenfeld et al. 2013a, 2013b) overlapped. The stellar masses of SL2S are estimated with two different initial mass functions. Note that the aperture of velocity dispersion in C. N. Hao et al. (2006a) is one-eighth of the effective radius, and the data points in Figure 2 are corrected with the relation in M. Cappellari et al. (2006) to match our 0.5 Reff aperture. We also note that the stellar masses of the C. N. Hao et al. (2006a) sample are taken from A. Gallazzi et al. (2005), where they are calculated by the BC03 model (G. Bruzual & S. Charlot 2003), based on a Chabrier initial mass function. Right: distribution of Einstein radii and effective radii of our sample. The data points in Figure 1 of A. Sonnenfeld et al. (2013a) are also plotted (T. Treu & L. V. E. Koopmans 2004; M. W. Auger et al. 2010; J. R. Brownstein et al. 2012). The dashed line means y = x.
Other Images in This Article
Show More
Copyright and Terms & Conditions
© 2026. The Author(s). Published by the American Astronomical Society.

