

Image Details
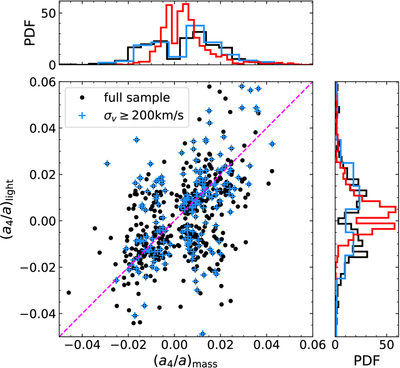
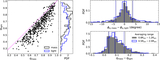
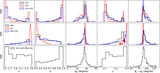
Caption: Figure 5.
Comparison of a4/a between the mass and light distributions for our full galaxy sample (black points and histograms) and a subsample with velocity dispersion σv ≥ 200 km s−1 (blue points and histograms). The magenta dashed line means y = x, and the red histogram is the distribution from C. N. Hao et al. (2006a).
Other Images in This Article
Show More
Copyright and Terms & Conditions
© 2026. The Author(s). Published by the American Astronomical Society.

Copyright ©
2026 Astronomy Image Explorer. All Rights Reserved.
