

Image Details
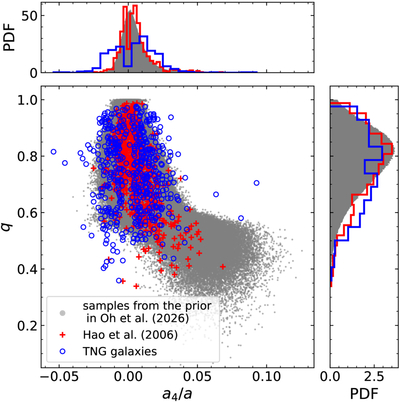
Caption: Figure 7.
Relation between m4 strength a4/a and axis ratio q. Blue points and histograms: our sample; red points and histograms: C. N. Hao et al. (2006a); gray points and shaded histograms: random sample generated by prior in M. S. H. Oh et al. (2026). See also Figure 6 in S. Hou et al. (2026).
Other Images in This Article
Show More
Copyright and Terms & Conditions
© 2026. The Author(s). Published by the American Astronomical Society.

Copyright ©
2026 Astronomy Image Explorer. All Rights Reserved.
