

Image Details
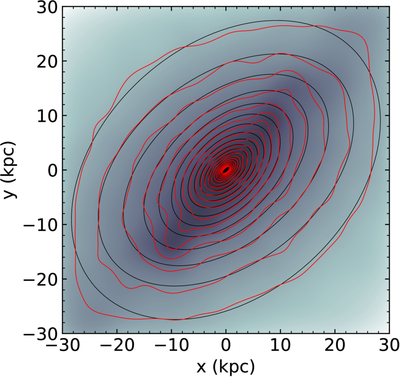
Caption: Figure 3.
An example of the isophote-fitting results of simulation galaxies (subhalo ID: 208612; projected along the z-axis). Background gray-scale map: r-band light distribution; red lines: isodensity contours of total mass density distributions; black lines: elliptical isodensity contours fitted to the mass map.
Other Images in This Article
Show More
Copyright and Terms & Conditions
© 2026. The Author(s). Published by the American Astronomical Society.

Copyright ©
2026 Astronomy Image Explorer. All Rights Reserved.
