

Image Details
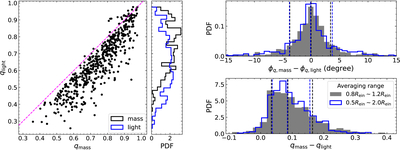
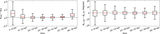
Caption: Figure 4.
Difference in axis ratio q and position angle ϕq between mass and light. Left: principal values of axis ratio q for mass and light maps of our galaxy sample, with both histograms added in the panel to the right. The magenta dashed line means y = x. Right: difference of averaged ϕq and q (within two annuli) between mass and light maps for our sample. Dashed lines indicate 16%, 50%, and 84% quartiles.
Other Images in This Article
Show More
Copyright and Terms & Conditions
© 2026. The Author(s). Published by the American Astronomical Society.

Copyright ©
2026 Astronomy Image Explorer. All Rights Reserved.
