

Image Details
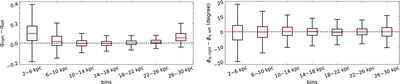
Caption: Figure 9.
Box plot of variations in q and ϕq (value at the right side minus that at the left side) in different radial bins with a width of 4 kpc. Left: difference in q; right: difference in ϕq. For each bin, the red line means median, the box spans from Q1 (first quartile) to Q3 (third quartile), and the whiskers extend from the box to the smallest and largest values within 1.5 × interquartile range. The dashed line indicates zero difference.
Other Images in This Article
Show More
Copyright and Terms & Conditions
© 2026. The Author(s). Published by the American Astronomical Society.

Copyright ©
2026 Astronomy Image Explorer. All Rights Reserved.
