

Image Details
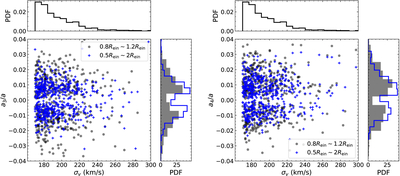
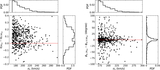
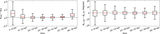
Caption: Figure 6.
Relations between multipole strengths from total mass maps and velocity dispersion. Left: a3/a versus σv; right: a4/a versus σv. For comparison, the multipole strengths are averaged within two different annuli (as the right panel of Figure 4): 0.8–1.2 Rein (gray points and shaded histogram) and 0.5–2.0 Rein (blue points and histogram).
Other Images in This Article
Show More
Copyright and Terms & Conditions
© 2026. The Author(s). Published by the American Astronomical Society.

Copyright ©
2026 Astronomy Image Explorer. All Rights Reserved.
