

Image Details
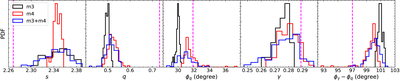
Caption: Figure 12.
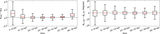
Distributions of the best (successful) macromodel parameters, s, q, ϕq, γ, and ϕγ − ϕq, for three kinds of perturbations (m3, m4, m3+m4), each added to EPL+γ to fit both image positions and flux ratios (assuming σf = 2% and σp = 10 mas, essentially the last row in Table 4). The vertical lines indicate the parameter values of one example successful mass model from m3+m4+PAv+Qv, for which the image configuration along with the corresponding critical curves and caustics are shown in Figure 13.
Other Images in This Article
Show More
Copyright and Terms & Conditions
© 2026. The Author(s). Published by the American Astronomical Society.

Copyright ©
2026 Astronomy Image Explorer. All Rights Reserved.
