

Image Details
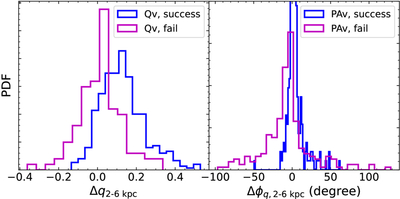
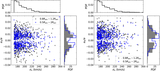
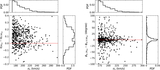
Caption: Figure 11.
The left panel presents the distributions of the radial difference Δq2−6 kpc ≡ q6 kpc − q2 kpc for both the successful and failed cases when adopting EPL+γ in the presence of perturbation Qv alone (assuming σf = 10%, σp = 10 mas), and in the right panel are the distributions for Δϕq, 2−6 kpc ≡ ϕq, 6 kpc − ϕq, 2 kpc when adding perturbation PAv alone. The samples essentially correspond to the fourth row in Table 4.
Other Images in This Article
Show More
Copyright and Terms & Conditions
© 2026. The Author(s). Published by the American Astronomical Society.

Copyright ©
2026 Astronomy Image Explorer. All Rights Reserved.
