

Image Details
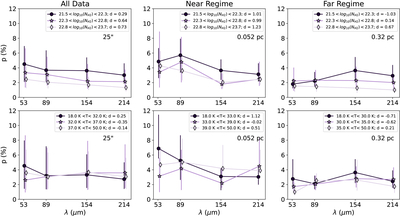
Caption: Figure 8.
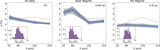
Polarization spectra created by separating the p data in ﹩{N}_{{{\rm{H}}}_{2}}﹩ (top) and T (bottom) bins using circles, stars, and diamonds for the lowest, middle, and highest bins, respectively. The error bars denote the first and third quartiles of the binned data. This is done for all of the data at a resolution of 25″ (left), the near regime at a resolution of 0.052 pc (middle), and the far regime at a resolution of 0.32 pc (right). The bins we use are denoted in the legends. We also denote the Cohen’s d, calculated as defined in the text, of each spectrum in the legend.
Other Images in This Article
Show More
Copyright and Terms & Conditions
© 2026. The Author(s). Published by the American Astronomical Society.

Copyright ©
2026 Astronomy Image Explorer. All Rights Reserved.
