

Image Details
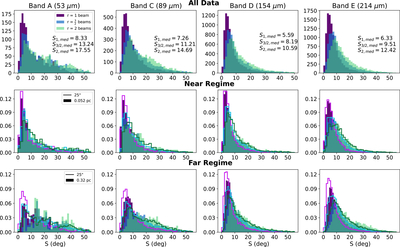
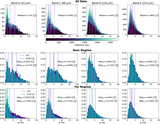
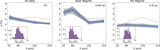
Caption: Figure 5.
Histograms of the angular dispersion calculated over three different areas with radii of 1, 3/2, and 2 beams. Top: all of the data smoothed to 25″. The median S values for the three different radii are denoted on each plot. Middle: normalized histograms of the near regime data smoothed to 25″ (solid lines) and smoothed to 0.052 pc (shaded regions). Bottom: normalized histograms of the far regime data smoothed to 25″ (solid lines) and smoothed to 0.32 pc (shaded regions).
Other Images in This Article
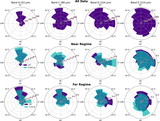
Show More
Copyright and Terms & Conditions
© 2026. The Author(s). Published by the American Astronomical Society.

Copyright ©
2026 Astronomy Image Explorer. All Rights Reserved.
