

Image Details
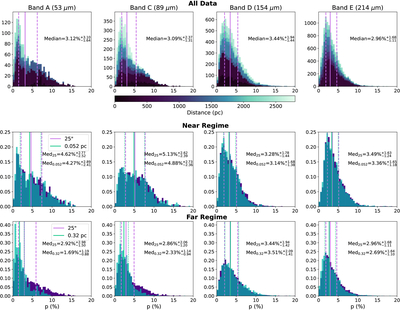
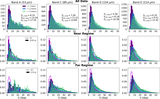
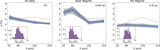
Caption: Figure 6.
Histograms of the percent polarization. Top: all of the data in a stacked histogram smoothed to 25″. The data are colored based on their distance. Middle: normalized histograms of the data in the near regime smoothed to 25″ (purple) and smoothed to 0.052 pc (cyan). Bottom: normalized histograms of the data in the near regime smoothed to 25″ (purple) and smoothed to 0.32 pc (cyan). The medians with first and third quartiles are denoted in text on the plots. The solid line is the median value and the two segmented lines show the first and third quartiles.
Other Images in This Article
Show More
Copyright and Terms & Conditions
© 2026. The Author(s). Published by the American Astronomical Society.

Copyright ©
2026 Astronomy Image Explorer. All Rights Reserved.
