

Image Details
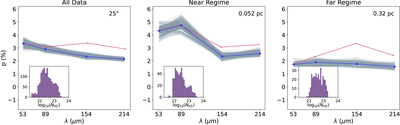
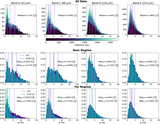
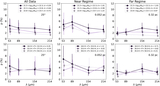
Caption: Figure 9.
Polarization spectra computed over constant ﹩{N}_{{{\rm{H}}}_{2}}﹩ distributions for all of the data (left), the near regime smoothed to 0.052 pc (middle), and the far regime smoothed to 0.32 pc (right). The blue spectra are the median p values of the 1000 samples. The gray lines show the p for each of the 1000 trials. The inset histograms show the distribution of ﹩{N}_{{{\rm{H}}}_{2}}﹩ every band is fixed to. The pink data points are the same as the common resolution data medians reported in Figure 6.
Other Images in This Article
Show More
Copyright and Terms & Conditions
© 2026. The Author(s). Published by the American Astronomical Society.

Copyright ©
2026 Astronomy Image Explorer. All Rights Reserved.
