

Image Details
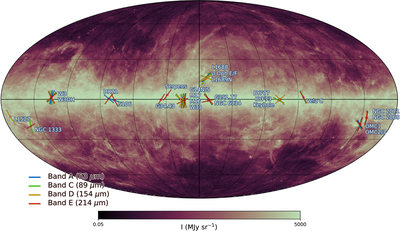
Caption: Figure 1.
Sky distribution of the 26 regions used in this paper. Each region is marked with a pink dot on a galactic projection full-sky map of the Planck 857 GHz data with histogram equalized color mapping. The vectors represent the average magnetic field orientation for each region as a function of wavelength (colors shown in legend).
Other Images in This Article
Show More
Copyright and Terms & Conditions
© 2026. The Author(s). Published by the American Astronomical Society.

Copyright ©
2026 Astronomy Image Explorer. All Rights Reserved.
