

Image Details
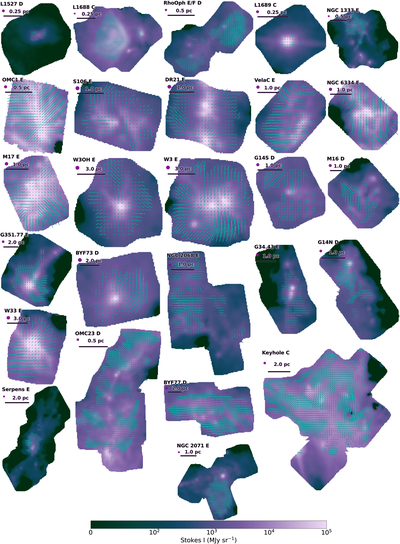
Caption: Figure 2.
A representative HAWC+ dataset from each of the 26 regions. Each region is labeled with its name and a letter denoting the HAWC+ band shown. The purple circle shows the beam size. The vectors are the magnetic field pseudovectors and their length corresponds to the percent polarization. The pseudovectors are sampled so there is one vector per beam. The scale bar denotes the physical size in parsecs calculated from the distances in Table 1.
Other Images in This Article
Show More
Copyright and Terms & Conditions
© 2026. The Author(s). Published by the American Astronomical Society.

Copyright ©
2026 Astronomy Image Explorer. All Rights Reserved.
