

Image Details
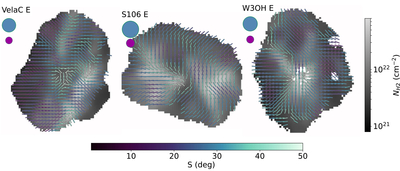
Caption: Figure 4.
Example maps of the column density with magnetic field pseudovectors overplotted. The vectors are color coded by the angular dispersion and have constant length. The blue circle shows the size of the disk that the dispersion is calculated over and the purple circle shows the 25″ beam.
Other Images in This Article
Show More
Copyright and Terms & Conditions
© 2026. The Author(s). Published by the American Astronomical Society.

Copyright ©
2026 Astronomy Image Explorer. All Rights Reserved.
