

Image Details
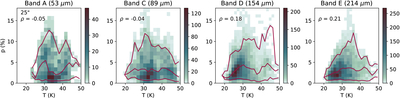
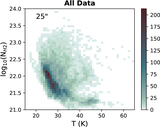
Caption: Figure A2.
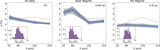
2D histograms of p as a function of T. The three red lines from bottom to top are the 5th percentile, median, and 95th percentile. These plots include data from all 26 regions at a resolution of 25″. The calculated Spearman ρ-value is denoted on each plot.
Other Images in This Article
Show More
Copyright and Terms & Conditions
© 2026. The Author(s). Published by the American Astronomical Society.

Copyright ©
2026 Astronomy Image Explorer. All Rights Reserved.
