

Image Details
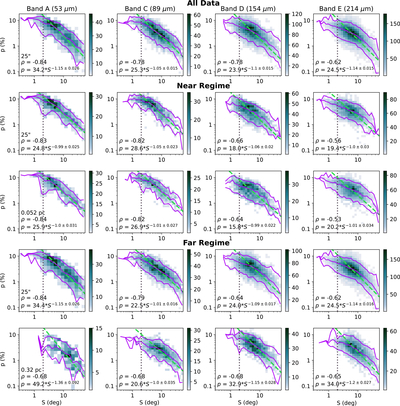
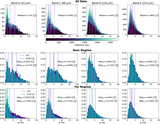
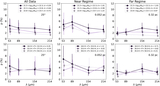
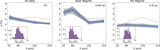
Caption: Figure 14.
2D histograms of p as a function of S separated by HAWC+ band. The three purple lines from bottom to top are the 5th percentile, median, and 95th percentile. The dashed green line shows the power law derived from the principal axis as described in Section 5.5. The resulting equation and Spearman ρ are denoted on each subplot. The vertical gray dotted lines show the location of the S < 2∘ cut we use when determining the principal axis of the distribution.
Other Images in This Article
Show More
Copyright and Terms & Conditions
© 2026. The Author(s). Published by the American Astronomical Society.

Copyright ©
2026 Astronomy Image Explorer. All Rights Reserved.
