

Image Details
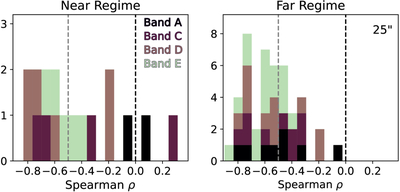
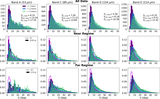
Caption: Figure 13.
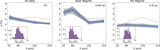
Stacked histograms of the Spearman ρ coefficients between p and ﹩{N}_{{{\rm{H}}}_{2}}﹩ for the individual datasets separated into the near (left) and far (right) regimes at the common angular resolution. The data in each band are stacked and are colored blue, green, orange, and red for Bands A, C, D, and E, respectively. The gray dashed line is at ρ = −0.5 and the black dashed line is at ρ = 0.
Other Images in This Article
Show More
Copyright and Terms & Conditions
© 2026. The Author(s). Published by the American Astronomical Society.

Copyright ©
2026 Astronomy Image Explorer. All Rights Reserved.
