

Image Details
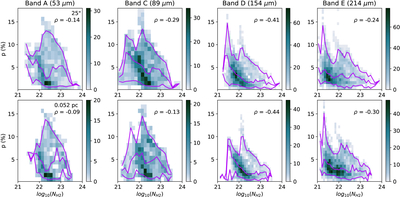
Caption: Figure 11.
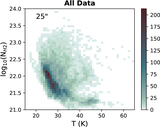
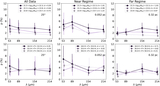
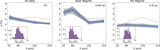
2D histograms of the percent polarization as a function of column density across the four HAWC+ bands for the near regime smoothed to 25″ (top) and 0.052 pc bottom. The three purple lines from bottom to top are the 5th percentile, median, and 95th percentile. The Spearman ρ coefficient of the data is reported on each plot to quantify the inverse relationship.
Other Images in This Article
Show More
Copyright and Terms & Conditions
© 2026. The Author(s). Published by the American Astronomical Society.

Copyright ©
2026 Astronomy Image Explorer. All Rights Reserved.
