

Image Details
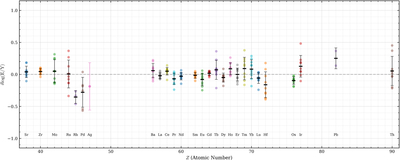
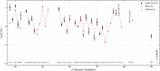
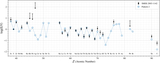
Caption: Figure E3.
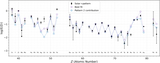
Residuals ﹩\delta \mathrm{log}({\rm{E}}/{\rm{Y}})﹩ for the 10 stars in the RPA sample (M. Racca et al. 2025). For each element except Ag, the thick horizontal bar marks the mean residual and the error bar shows the 1σ scatter about the mean. Ag has only one measurement, so the pink error bar gives its measurement uncertainty.
Other Images in This Article
Show More
Copyright and Terms & Conditions
© 2026. The Author(s). Published by the American Astronomical Society.

Copyright ©
2026 Astronomy Image Explorer. All Rights Reserved.
