

Image Details
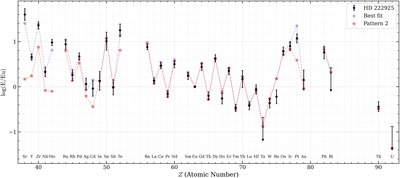
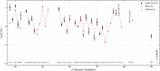
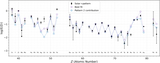
Caption: Figure 6.
Comparison of the best fit (violet stars) and Pattern 2 (red stars) with data (black symbols; I. U. Roederer et al. 2022b) on ﹩\mathrm{log}({\rm{E}}/{\rm{Eu}})﹩ for HD 222925. The best fit corresponds to a mixing parameter xEu = 3.2 × 10⁻², and its difference from Pattern 2 shows that contributions from Pattern 1 are mostly limited to the light r-process elements, Te, and Pt.
Other Images in This Article
Show More
Copyright and Terms & Conditions
© 2026. The Author(s). Published by the American Astronomical Society.

Copyright ©
2026 Astronomy Image Explorer. All Rights Reserved.
